https://www.instamojo.com/technicalview/alpha-fortune-investment-picks/
Regards
Ameeth Vorra
DRREDDY Weekly Chart
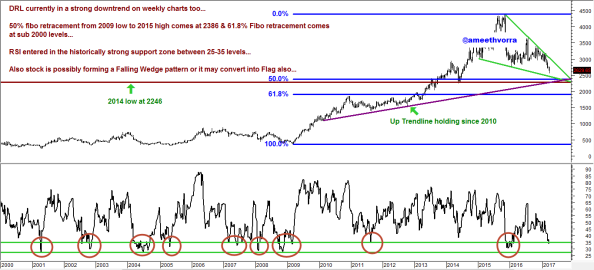
Stock is entering into strong support zone between 2500-2000 odd levels… Investor can look for buying opportunity in the above mentioned zone…
Regards
Ameeth Vorra
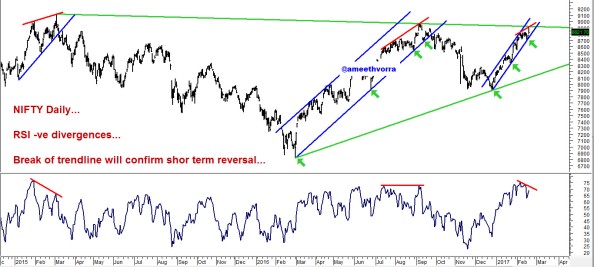
NIFTY Daily Chart…
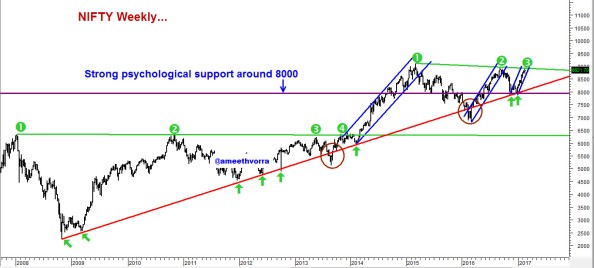
NIFTY Weekly Chart…
Regards
Ameeth Vorra
Date:- 24th & 25th Feb 2017
Timings:- 9.30 am to 6.30 pm
Venue:- Mumbai (Location will be updated soon)
Fees:- Rs.14000/- (Rs.5000/- as registration fees to be deposited on of before 10th Feb)
COURSE CONTENTS:-
Introduction to Stock Analysis
How to see what is there on the charts and remove bias and become an effective analyst
Why not everyone can be a Technical Analyst??
CandleSticks and CandleStick Patterns
1. How candlesticks are formed and how can they be used??
2. How to use candlesticks to spot bullish or bearish setups??
3. Most important candlestick patterns and how to spot and use them!!
Moving Averages / Moving Average Convergences
1. What are moving averages??. Which set of Moving Averages give the best result??
2. How to make use of MAs practically??
Price and Volume Analysis
1. Price and Volume relation. What can be figured out using this relation??
Higher Tops Higher Bottoms / Trend Formations
1. Identifying strong trending markets using Dow Theory
2. How to scale up positions using dow theory.
Technical Patterns 1
1. Types of channels
2. How to carry out channel trading??.
3. Best channel set ups!!
Technical Patterns 2
Double Tops / Triple Tops
How to identify the above and find out what is happening from the charts!!
Technical Patterns 3
– Flags/Pennants
1. How short-term trading can be done using continuation patterns like Flags and pennants.
2. Target Calculations using the above pattern
Technical Patterns 4
Triangles and various types
1. How to use the above pattern for effective trading??
2 Target calculations
Technical Patterns 5
Cup and Handle
1. How to spot whether cup and handle is forming??
2. Target Calculations
Fibonacci Retracement Levels:-
1.How markets reverse from Fibonacci levels
2. Using Fibonacci levels for effective trading and target calculations.
Head and Shoulders and Variations
1. Various types of head and shoulder formations!!
2. Which one to use and which to avoid ??
3. Target Calculations
How to scan stocks using Metastock and find winning stocks??
In this section discussion we will be discussing one method using which we have made good money. This method will filter out stocks which are making highs as per Dow theory and trade on that information. This is a proprietary indicator and uses discretion.
How to use RSI: A different view!!
In this section we will discuss how RSI can be used more effectively and differently from how it is currently used. This method can be used on any Time Frame but will produce best trades on longer Time frames.
For more details kindly contact me or my colleague on below-mentioned contact numbers and email IDs

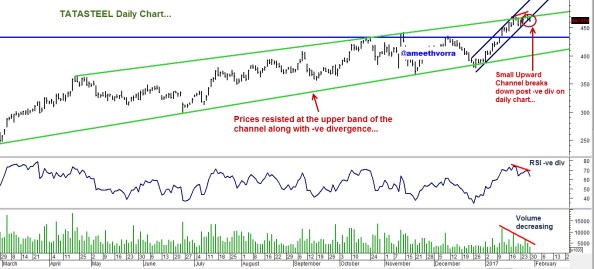
TATASTEEL Daily Chart
TATAMTRDVR Daily Chart
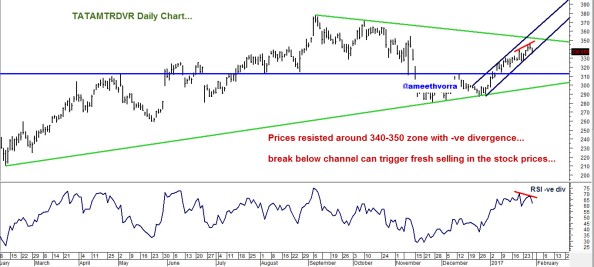
Best Regards
Ameeth Vorra
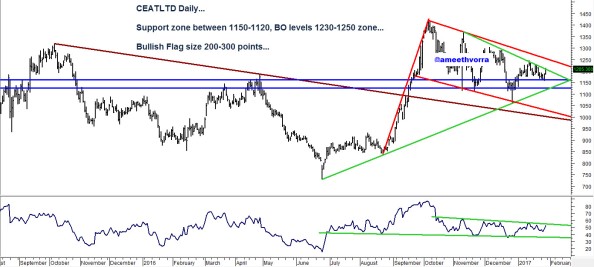
CEAT LTD Daily Chart
Regards
Ameeth Vorra
MCDOWELL Daily chart
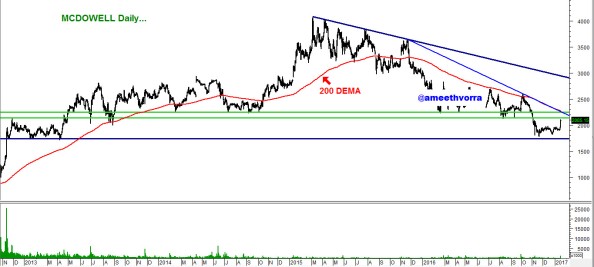
In the above chart stock is heading for a strong hurdle (zone) between 2140-2250. Trendline resistance also comes in between the above-mentioned zone. 200 DEMA level comes at 2274. Stock may react in the zone of 2140-2250.
Now lets have a look at weekly chart.
MCDOWELL Weekly Chart
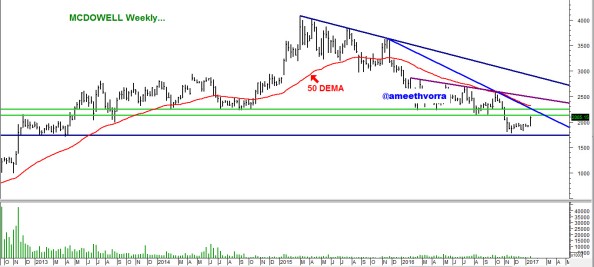
In the above chart weekly resistance comes in the zone of 2140-2250, whereas 50 DEMA level comes at 2322.
Stock may have formed the strong base between 1700-1900 zone which was mentioned previously in the tweet here, stock bounced back nicely from the same zone.
Regards
Ameeth Vorra
IDEA CELLULAR LTD WEEKLY Chart
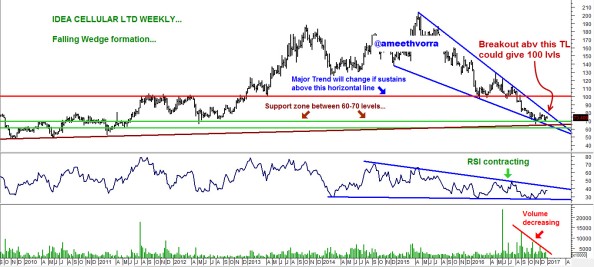
Planning a Technical Analysis Workshop on 24th and 25th Feb 2017, interested candidates can contact on ameethvorra at gmail dot com
Best Regards
Ameeth Vorra
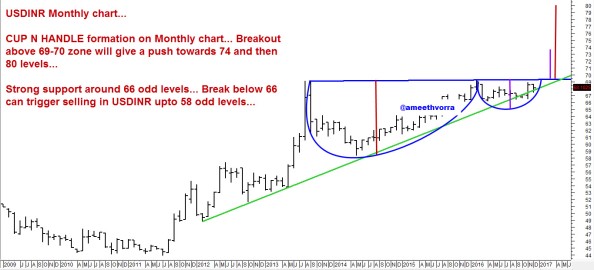
USDINR Monthly Chart
Regards
Ameeth Vorra
NIFTY VIEW 02nd January 2017
In the previous view of NIFTY dated 6th Nov it was clearly mentioned that below 8300-8350 Nifty may head for the next important zone around 7980-8000 levels. NIFTY broke 8300-8350 and hits lows around 7900 levels.
Now what’s next…
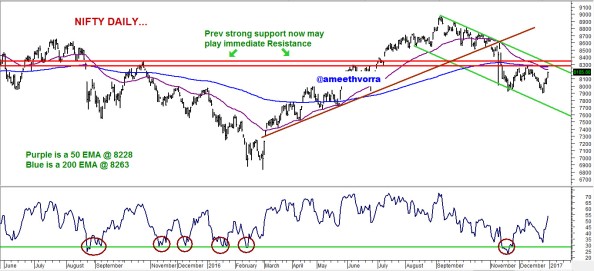
In the previous chart I did mention that RSI is heading for a reaction zone around 30-25 zone, it did enter in the zone and has reacted by bouncing off sharply from lows. RSI reacted around 23.81 (RSI levels) on 21st Nov and NIFTY rallied till 8275 which was a 50% retracement level of last swing move, NIFTY again faced resistance at 8275 and moved back to create fresh lows below 7916 and finally positive divergence happened on daily chart (which indicates lows around 7900 may hold, but in past we have also seen 3rd lower lows on NIFTY whereas RSI made 3rd higher low, giving us triple positive divergences), post that NIFTY rallied really sharp almost 400 points in just 5 sessions.
Current formation on NIFTY is “Lower Highs & Lower Lows” and this formation continues till NIFTY is sustaining below previous swing high at 8275. Trend may shift to up or sideways once it clears 8275.
Levels to watch out are 7900-8000 zone (for supports) and 8350-8300 for up move. NIFTY will resume the uptrend once it moves back above the downward sloping trend line (currently comes around 8300-8350 zone).
Now lets have a look at weekly chart of NIFTY…
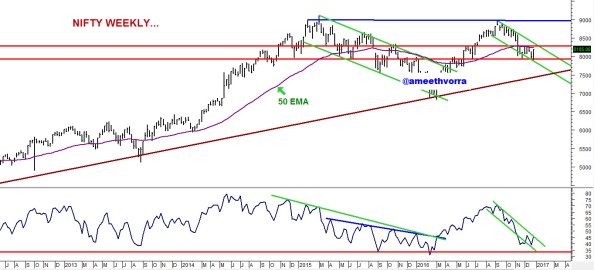
In the previous view I mentioned that NIFTY breaking down below 8700-8680 zone was the 1st confirmation of pause/reversal signal. Now as you can see NIFTY is trading in a downward sloping channel, and If the bottom is strong around 7900 levels then we may go into sideways for 1-3 weeks before giving some directional move above 8300-8350 zone.
NIFTY sustained consecutively 7 weeks below 50 WEMA (indicates weak undertone).
Levels to watch out are 8300-8350 weekly closing basis above which it may touch 8500-8600 zone. Fresh selling would come below sustaining below 7900-8000 zone.
CONCLUSION:-
Nifty is in LHLL formations on daily chart which suggests that the short term trend is down till its trading below 8275 levels.
200 DEMA @ 8263 (NIFTY is trading below 200 DEMA since 11th Nov which indicates weakness in market)
50 DEMA crossed 200 DEMA on downside (termed as DEATH CROSS) post 1st June 2016, indicates weakness.
50 WEMA @ 8242 (NIFTY is trading below 50 WEMA continuously from last 7 weeks post 27th May 2016)
Strong support zone is now placed between 7700-7500 levels.
Planning a Technical Analysis Workshop on 24th and 25th Feb 2017, interested candidates can contact on ameethvorra at gmail dot com
Wish you all a very Happy 1st trading week of the year 2017…
Best Regards
Ameeth Vorra
