MCDOWELL Daily chart
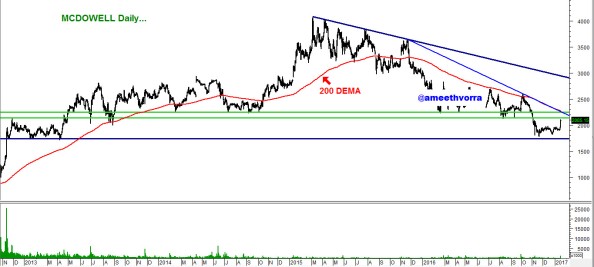
In the above chart stock is heading for a strong hurdle (zone) between 2140-2250. Trendline resistance also comes in between the above-mentioned zone. 200 DEMA level comes at 2274. Stock may react in the zone of 2140-2250.
Now lets have a look at weekly chart.
MCDOWELL Weekly Chart
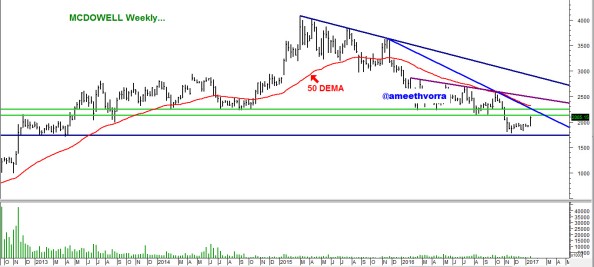
In the above chart weekly resistance comes in the zone of 2140-2250, whereas 50 DEMA level comes at 2322.
Stock may have formed the strong base between 1700-1900 zone which was mentioned previously in the tweet here, stock bounced back nicely from the same zone.
Regards
Ameeth Vorra
